Backtesting
Backtesting replays real recent prices against your grid configuration so you can see how it would have behaved before risking a dollar. It's the cheapest way to size a range and spacing sensibly.
How to run one
Open the backtesting modal from the configuration panel with your grid set up. Choose a period:
- 7 days — the default; finest detail.
- 15 days
- 30 days — note that 30‑day backtests use 15‑minute candles, so very short‑timeframe trades may not be captured.
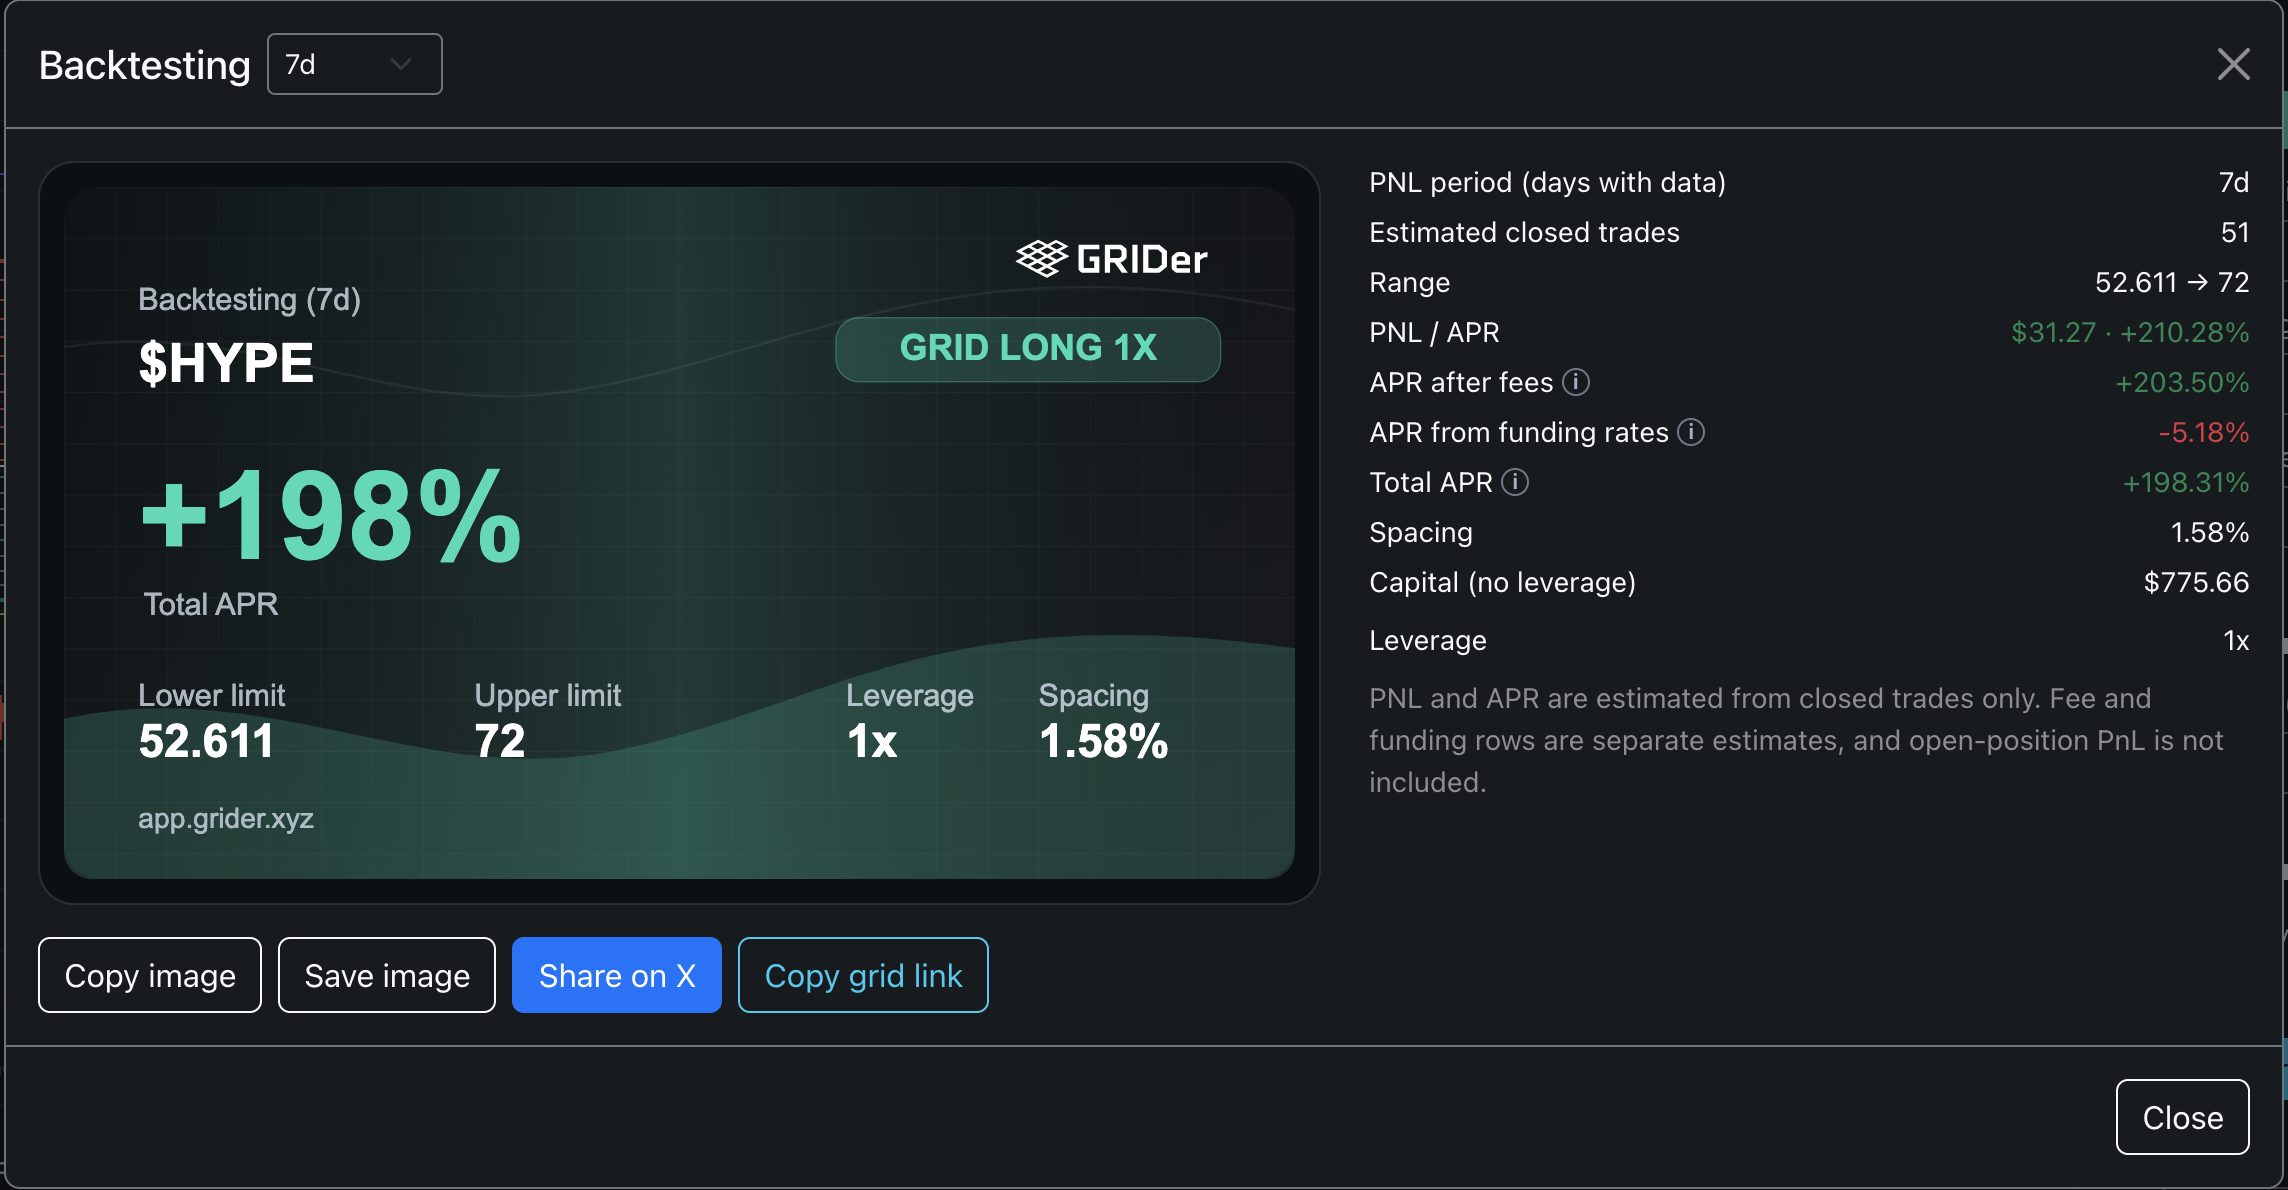
GRIDer simulates the grid over that window and reports the trades it would have closed, the backtest PnL, volume, and an estimated APR, plus separate estimates for fees and funding.
What it includes — and what it doesn't
Backtesting is a guide, not a guarantee. Read the numbers with these limits in mind:
- ✅ Closed trades within the range are simulated, and PnL/volume come from them.
- ✅ Estimated fees and estimated funding are shown as separate rows, and a total APR combines them — but they're estimates for the analyzed window, not exact settlement.
- ❌ Open‑position PnL is not included. If price ends mid‑range, the value of what the grid would still be holding isn't in the figure.
- ❌ It doesn't stop at your stop‑loss. If price would have hit your stop, the backtest flags it as information but keeps simulating — so a result that "looks great" may have blown through a stop you'd have wanted to honour. Check that.
- ❌ Past behaviour ≠ future behaviour. A range that held for 7 days can break on day 8.
If there's no available balance for the market, the backtest runs against a default reference grid size so you can still compare setups.
How to read it
- More closed trades in the window generally means the spacing suited the token's volatility.
- A very high APR on a small‑cap or exotic market usually reflects extreme volatility — i.e. higher breakout risk, not free money. Treat outsized numbers as a flag to widen the range or lower leverage, not a target.
- Compare a few configurations: tighten/loosen spacing, widen/narrow the range, and watch how trade count and the stop‑loss flag change.
Share and reuse a setup
When you've found a configuration you like:
- Share on X generates a branded card (with the token, range, APR, leverage and spacing) you can post. It's a great way to share results — the card is an image, so anyone replicating it copies the parameters.
- Copy grid link copies a link that opens the app with the grid preconfigured, so you (or someone you share it with) can load the exact setup in one click.
Next: when the result looks right, finish setting exits in Create a grid and start it, then follow it in Monitor & manage.