Strategies scanner
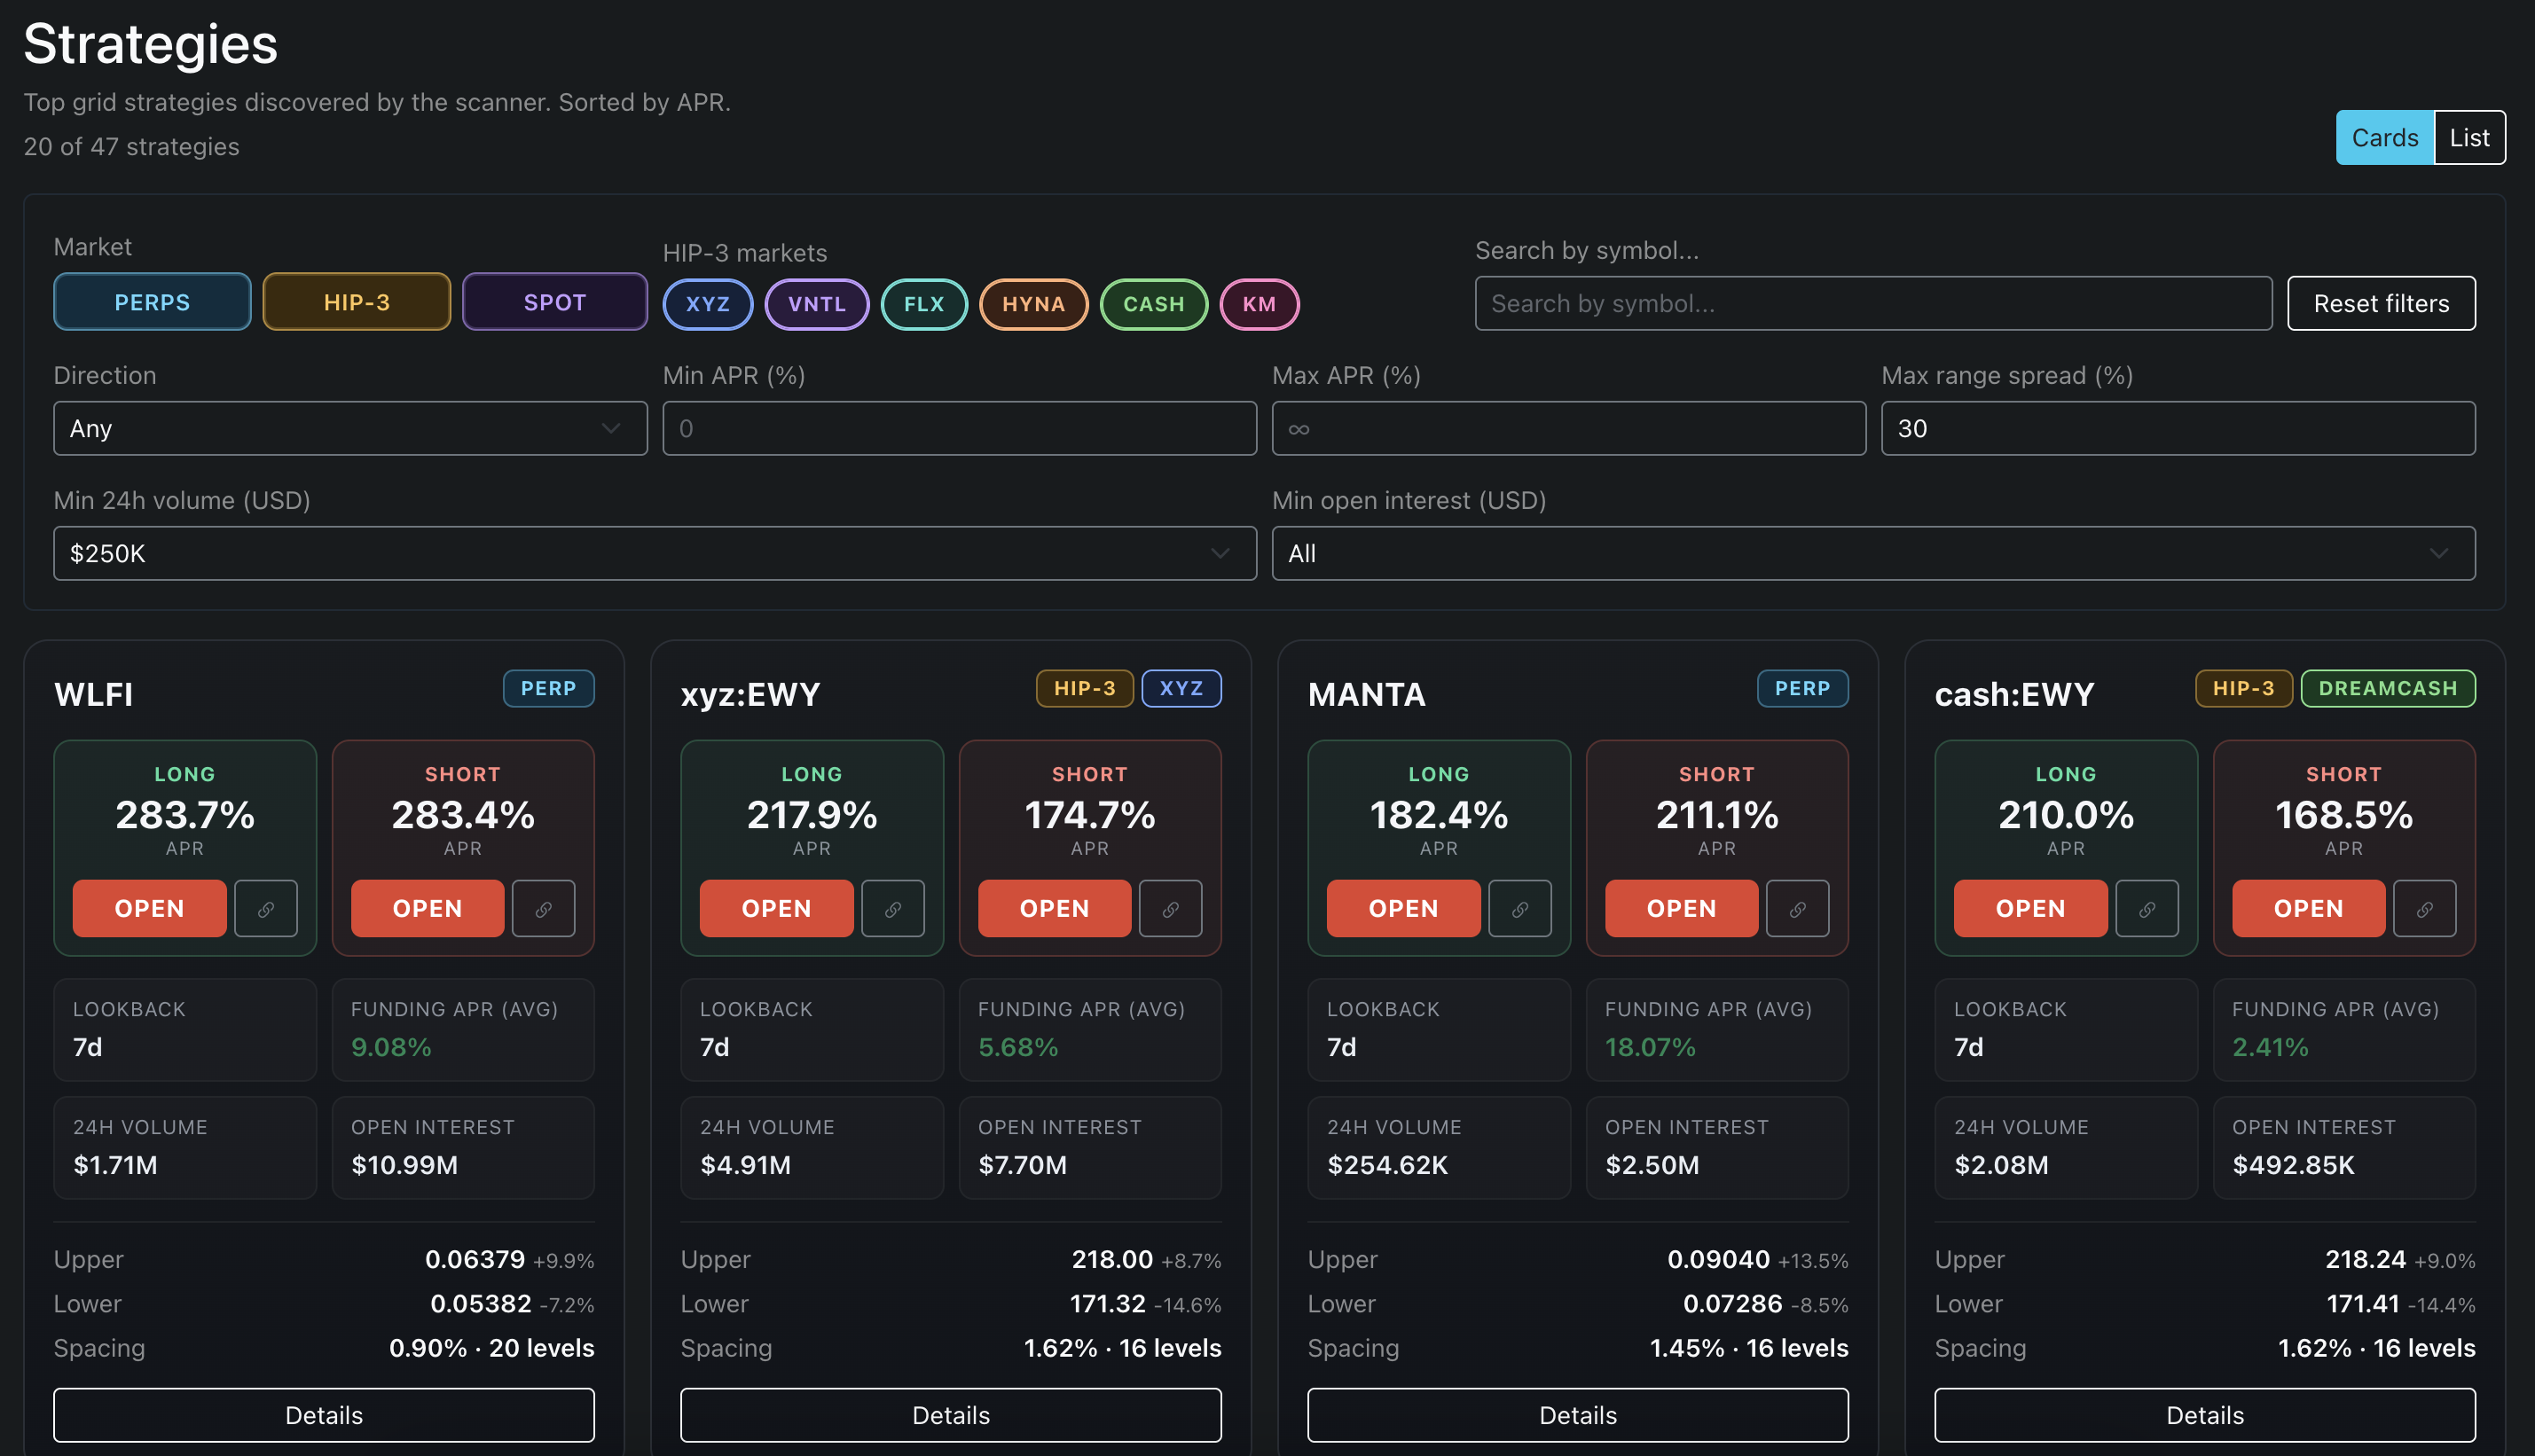
The Strategies tab scans the exchange's markets daily and shows ranked strategies with your filters applied, so you can find candidate tokens and ranges instead of guessing. It covers 200+ markets — perpetuals and HIP‑3 builder markets — plus spot.
What it shows
For each market, the scanner backtests a reference grid and reports:
- Backtest PnL and Backtest volume — calculated on a $1,000 reference investment so markets are comparable.
- Spacing and Levels of the reference grid.
- Direction — and you can compare Long vs Short for the same market.
- Funding — current funding rate and an average Funding APR, since funding can tilt a perp grid's economics.
Because the values use a common reference size, they're for comparison, not a prediction of your own result. When you open a market, the figures are explicitly noted as based on that $1,000 reference.
Filtering
Narrow the list to what you care about:
- Market — Perps, HIP‑3 markets, Spot, or any combination.
- HIP‑3 markets — include or exclude specific builders such as XYZ, VNTL, FLX, HYNA, CASH or KM.
- Search — find a specific symbol.
- Direction — Any, Long, or Short.
- Min APR / Max APR — focus on a return band and avoid unrealistic outliers.
- Max range spread (%) — cap how wide the proposed range is.
- Min 24h volume (USD) and Min open interest (USD) — filter out thin markets.
A sensible starting point is Max range spread: 40% and Min 24h volume: $250K. That keeps the list focused on markets with enough liquidity and ranges that are not excessively wide. Each filter is a different lens: e.g. "spot markets, long, with healthy volume" is a very different shortlist from "perps, short, high funding APR."
From a candidate to a grid
When a market looks promising, click Open on the LONG or SHORT side to load the app with that strategy preconfigured — token, range, spacing and direction ready to review. From there you can backtest it yourself and adjust before starting. The link icon copies a shareable deep link to the same setup. See Backtesting and Create a grid.
Reading APR responsibly
The scanner will surface very high APRs on small‑cap and exotic HIP‑3 markets — sometimes several hundred percent. Treat these as a volatility signal, not a yield promise:
- A high backtested APR reflects large, frequent swings — which is exactly the condition that also produces bigger breakout risk.
- The number is historical and uses a reference size; your real result depends on your range, capital, fees, funding and what price does next.
- Extreme figures are usually a cue to widen the range, reduce leverage, or pass — not to size up.
Use the scanner to shortlist, then let backtesting and risk management make the call.
Next: Profile & history.